Polls have errors. Not errors in the sense of mistakes, but statistical errors because they are not exact. They can never avoid having sampling error. If you sample one thousand people randomly, you might by chance have a sample with a high number of Conservatives, or of council-house tenants, or of young people. And that would distort your poll. Pollsters allow for sampling error by introducing control variates to reweight samples, but that can create new errors if there are calibration problems with the controls.
On its own, sample error can be up to three per cent for a single party in a thousand-people poll. A larger poll of polls with ten thousand people, should have an error of less than one per cent.
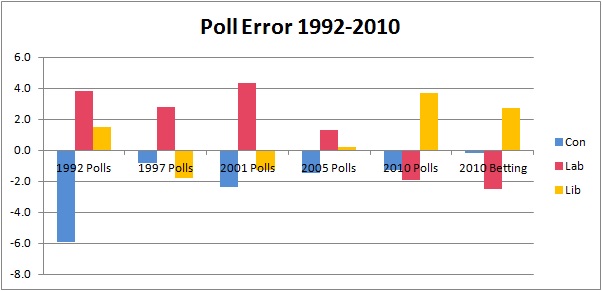
The graph above shows the historical track record of pollsters for the last five general elections. At each election it shows the difference between the pollsters' joint estimate for each party's support less the actual result. A positive value means the pollsters overestimated that party's support, and a negative value means they underestimated it. Sampling error should be less than one per cent for these averages.
The worst year by far was 1992 when the pollsters (and consequently Electoral Calculus) forecast a win for Labour under Neil Kinnock. The polls showed a Labour lead of 2%, but the real result was a Conservative lead of 8%. An industry post-mortem showed this was due to three main factors: bad control variate data, "shy Tories", and late swing.
Looking at the whole history, several facts start to stand out. Firstly, the errors are always bigger than the theoretical sampling error of one per cent. This means that the polls have additional errors and biases. Secondly, British pollsters have a track record of underestimating Conservative support (even ignoring 1992) by an average of one and a half per cent. Until recently, the pollsters also consistently overestimated Labour by an average of 1.5 pc. And at the last election, the polls overstated Liberal Democrat support by nearly four per cent.
One senior pollster said that although he didn't think the polls were wrong, he suspected the Conservatives might do better and UKIP might do worse than the polling average. One factor could be the difference between online and telephone polls, with online polls overstating the smaller parties.
But if we can't trust the polls, what is the alternative? One possibility is to look at the spread betting markets. At the last election, SportingIndex prices for seats implied a Conservative support of 36.8 pc which compared very well with the true outcome of 37.0 pc. But their implied Lib Dem support was also too high, though better than the polls. And their Labour error was slightly worse than the polls. On the whole the betting markets were marginally more accurate.
At the moment, there is a gap between the two. The current polls have a Labour lead of one per cent, but the betting markets imply a three per cent lead to the Conservatives. They can't both be right.
The best practical scientific advice in cases of uncertainty and multiple data sources is to take averages to even out errors. Never believe a single poll. Take averages of polls, averages over pollsters and averages of polls and spread betting. That should reduce error, but it can never eliminate it.